
Solution · Mobility and traffic
Camera-based mobility analytics: vehicles, passengers and traveller flows
Turn road, car park, station and onboard cameras into mobility measurement tools. Count and classify vehicles, measure boardings and alightings on buses and trains, and monitor footfall at stations and transport interchanges, using the areas your cameras can see.
No number plate recognition by default · Works by day and at night · Metrics available in Technis Spaces
Made in France — software designed and developed in France.
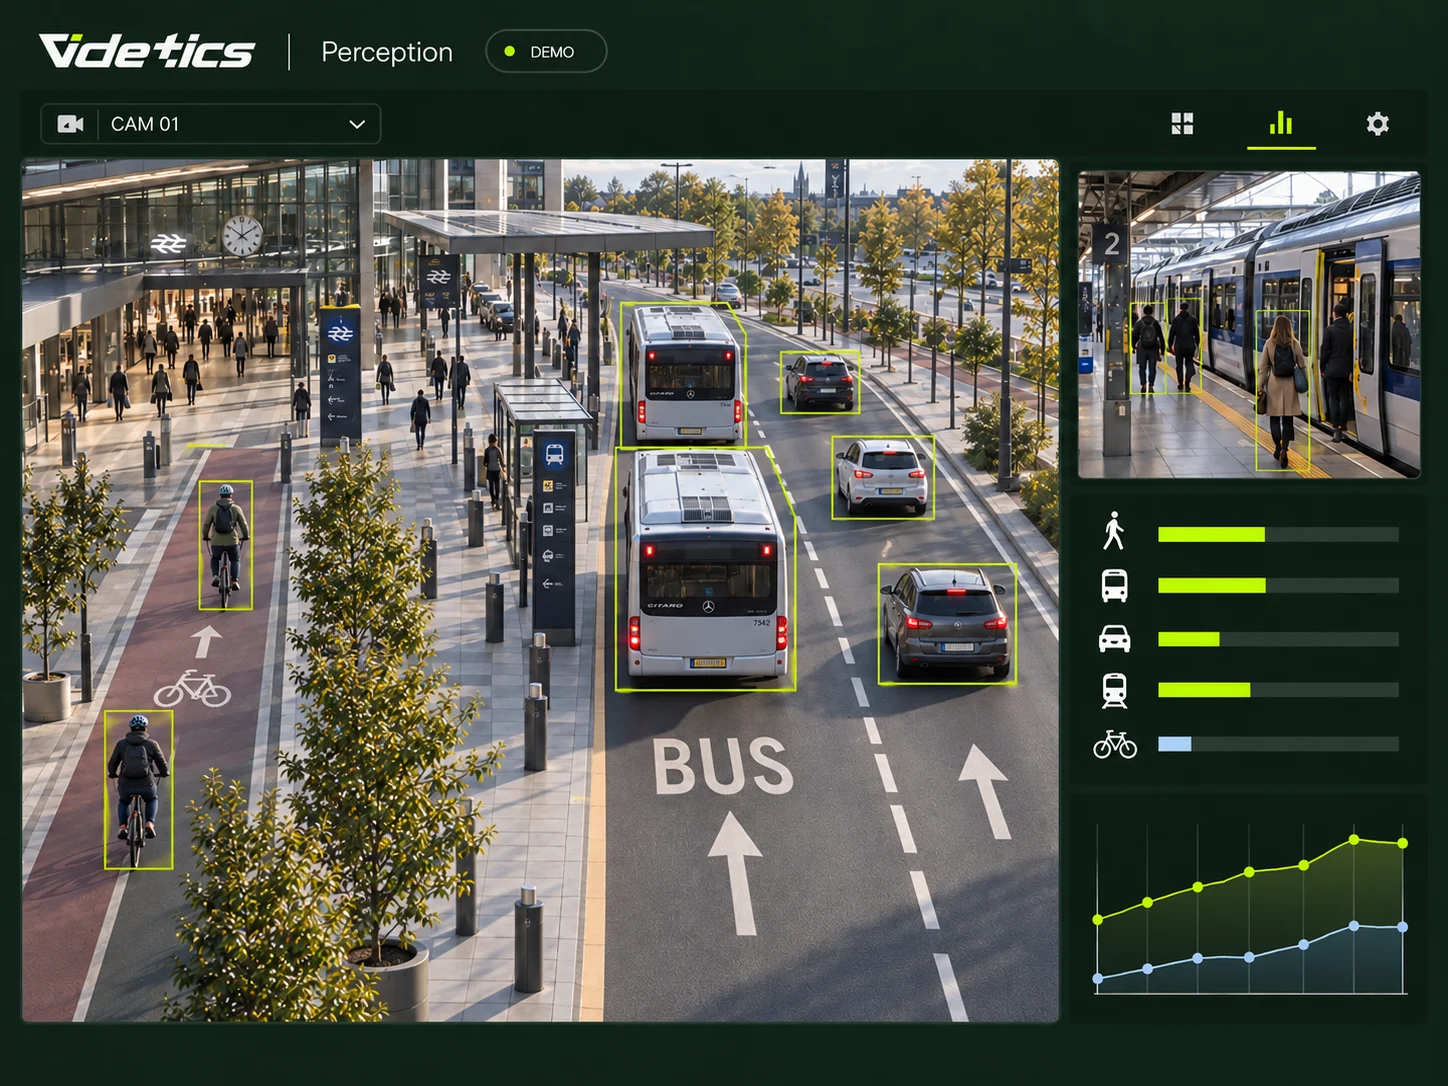
Traffic data without roadworks or extra sensors
Measuring traffic on a street still often means installing loops in the road, laying pneumatic tubes for a week or sending someone to count at a junction. The result is a costly snapshot, often out of date by the time a decision is made.
Your cameras already watch those same streets around the clock. Videtics Perception turns them into permanent traffic counters, by lane, direction and vehicle category, without touching the road surface.
What you can measure with your cameras
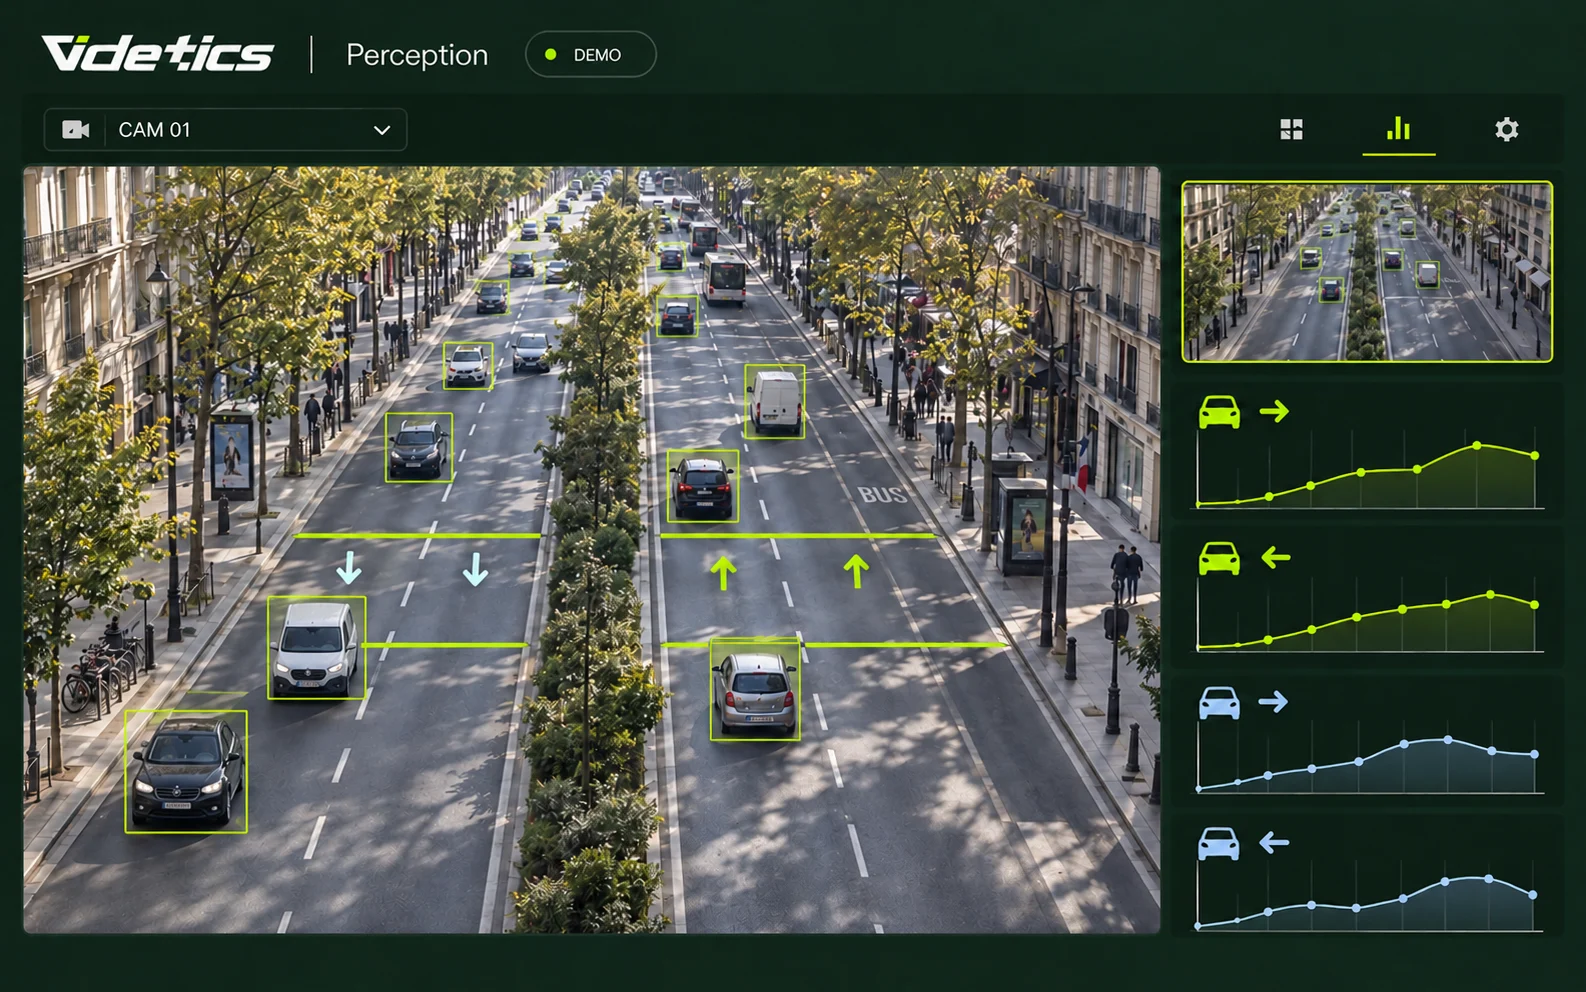
Vehicle counting by lane and direction
The challenge. How many vehicles use this road each day, at what times and in which direction?
What Perception does. Draw a line for each lane on the image; every vehicle crossing it is counted with its direction of travel.
What you receive. Traffic trends by lane, hour and day, ready for comparisons between periods.
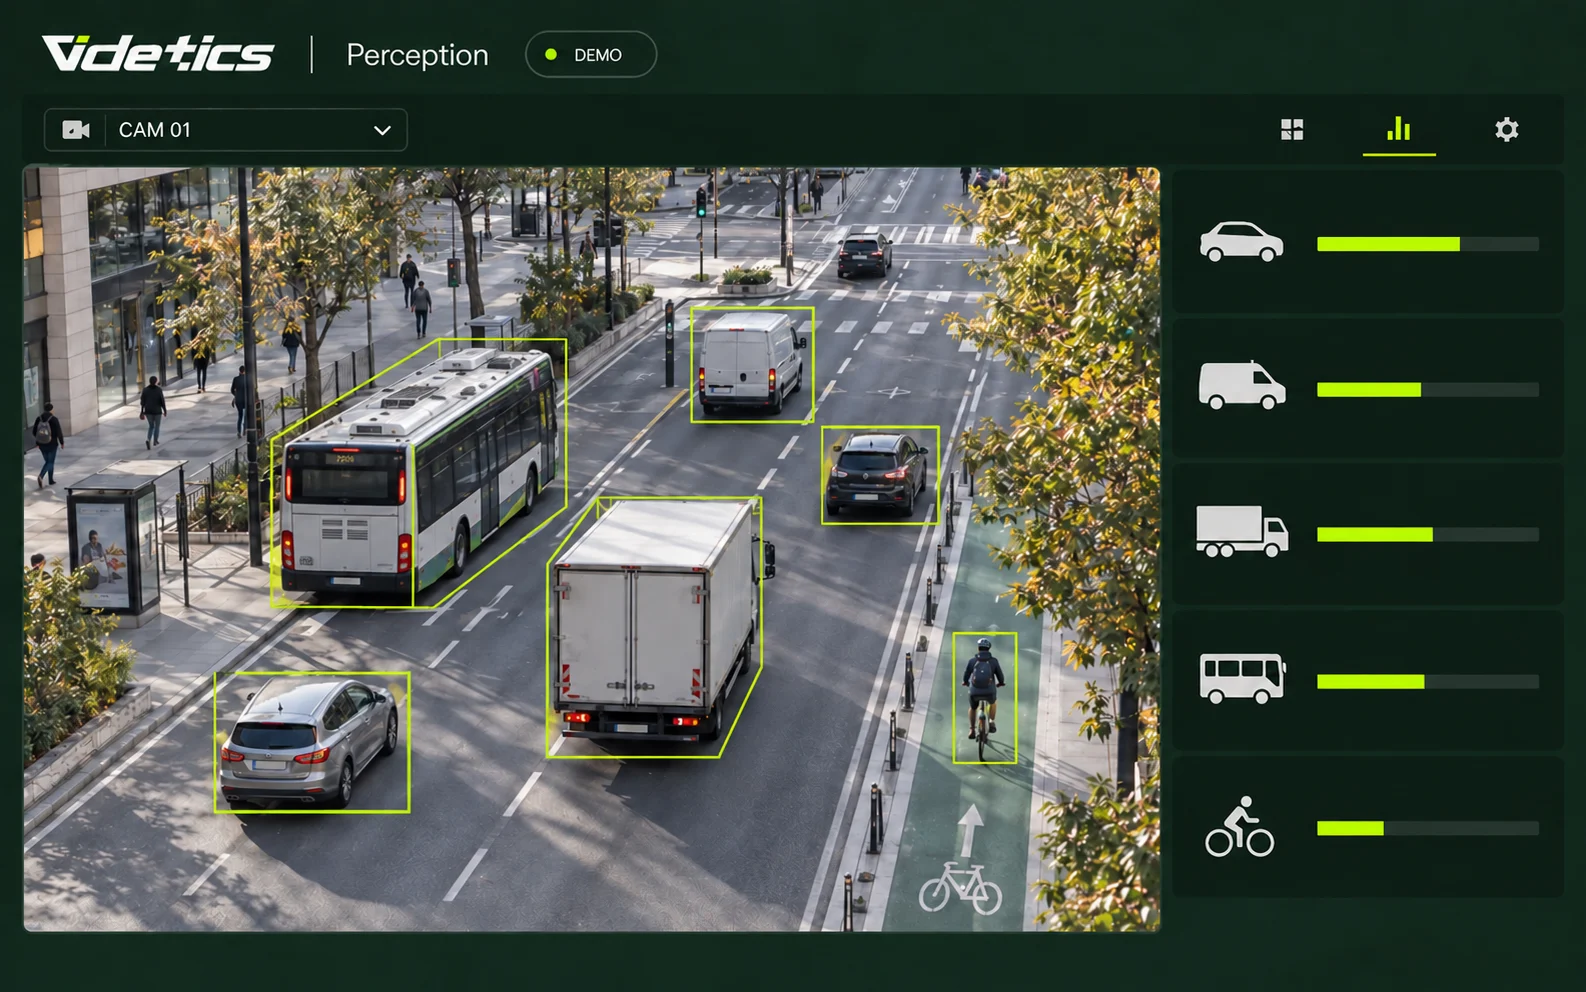
Vehicle classification
The challenge. A traffic plan needs more than a total: you need to know what is passing through.
What Perception does. It classifies every passage: car, van, heavy goods vehicle, bus, motorcycle, bicycle, pedestrian, and boats on the water.
What you receive. The share of each category, hour by hour. See how much heavy goods traffic a neighbourhood receives, or how cycling increases after a cycle lane opens.
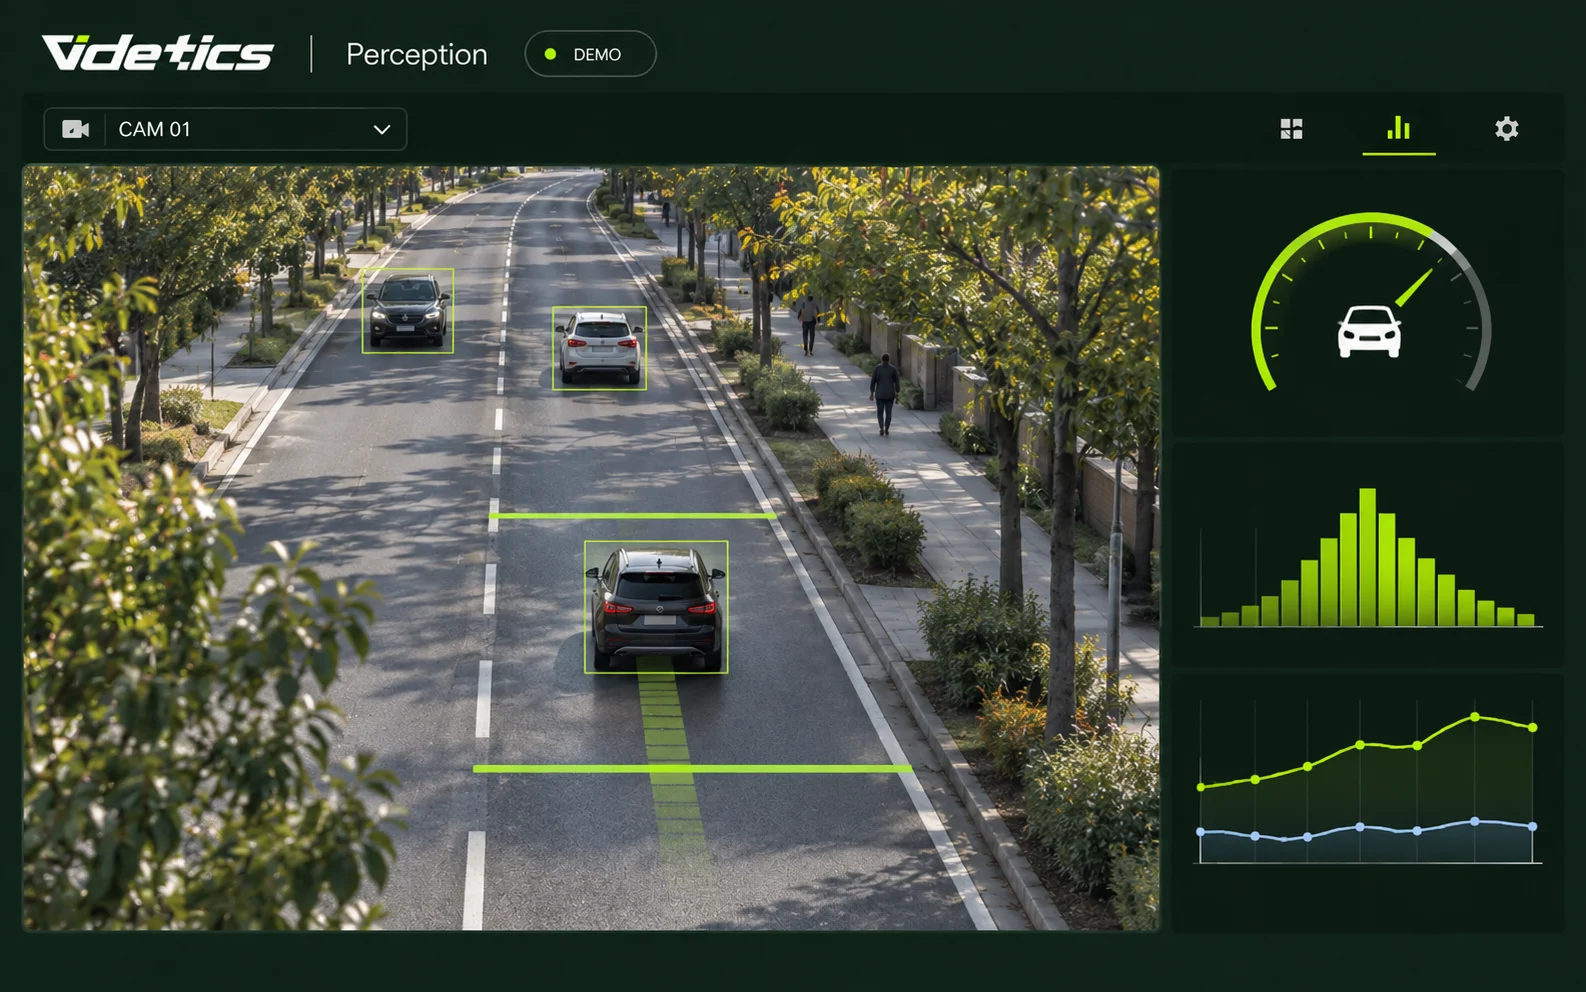
Speed estimation
The challenge. Residents complain about speeding; you need an indication of speeds before and after a road layout change.
What Perception does. It estimates the speed of each vehicle, bicycle or boat from its movement in the image.
What you receive. Average speed and a breakdown by speed band, lane and period. This is a decision-support metric, not an enforcement tool.
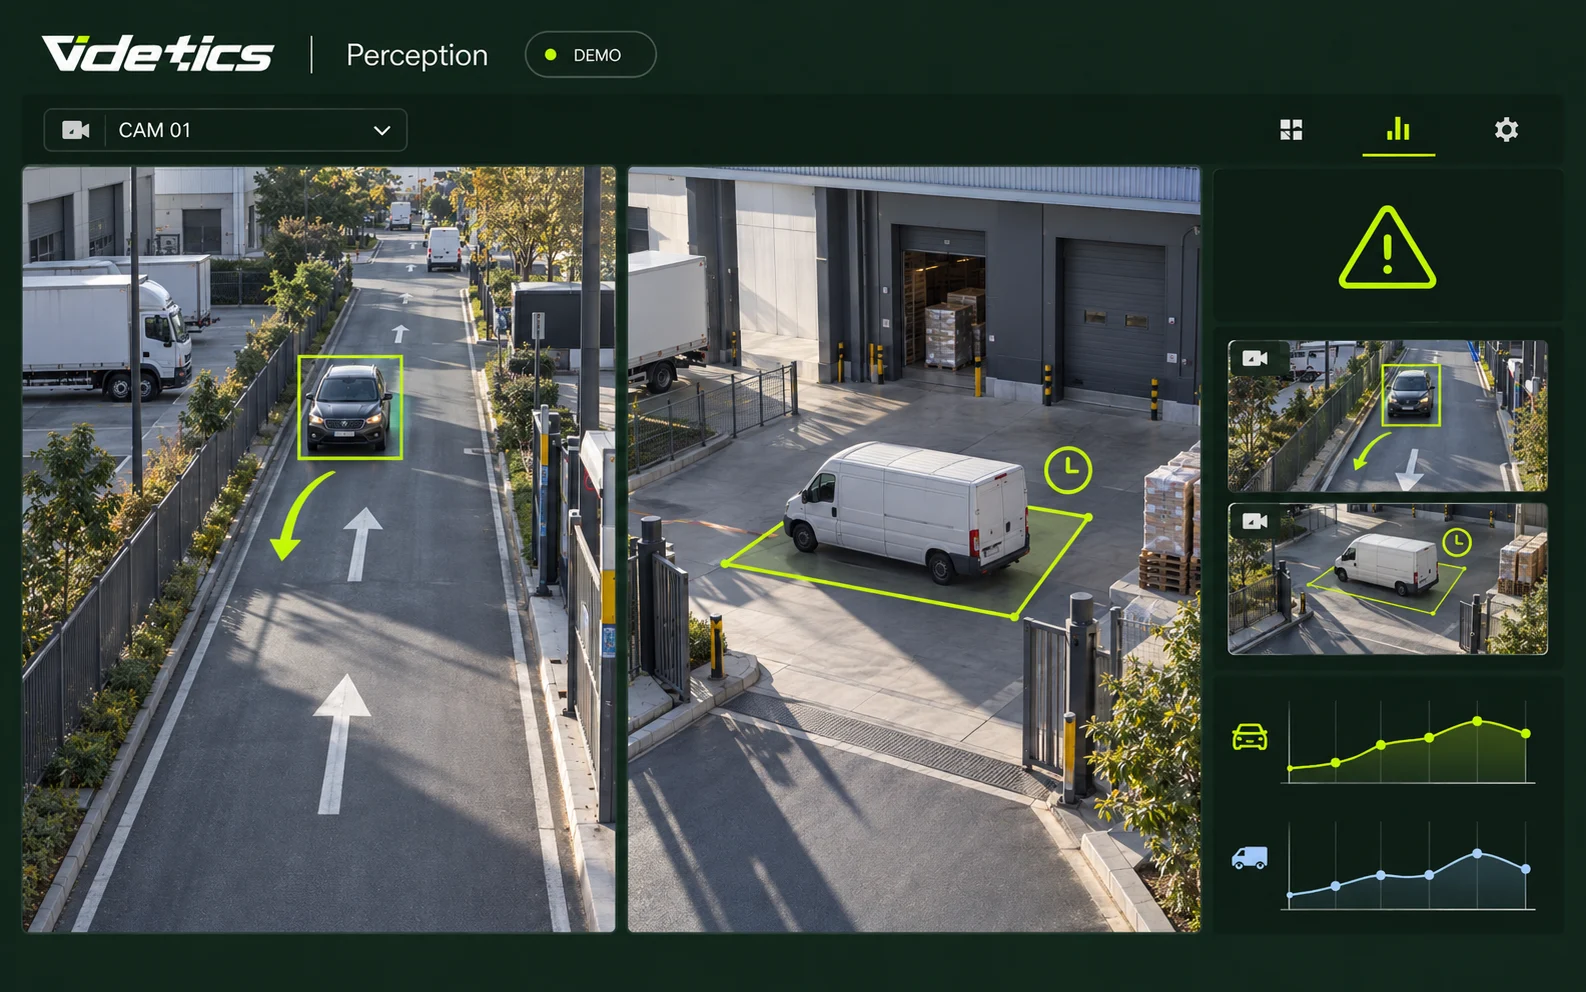
Wrong-way traffic and unusual stops
The challenge. A wrong-way vehicle on a slip road, a lorry stopped in a port lane or a parked vehicle blocking an entrance.
What Perception does. It knows the direction of each lane and detects vehicles travelling against it or stopping for longer than expected.
What you receive. A real-time alert to your control room or VMS. See alsosecurity alerts.
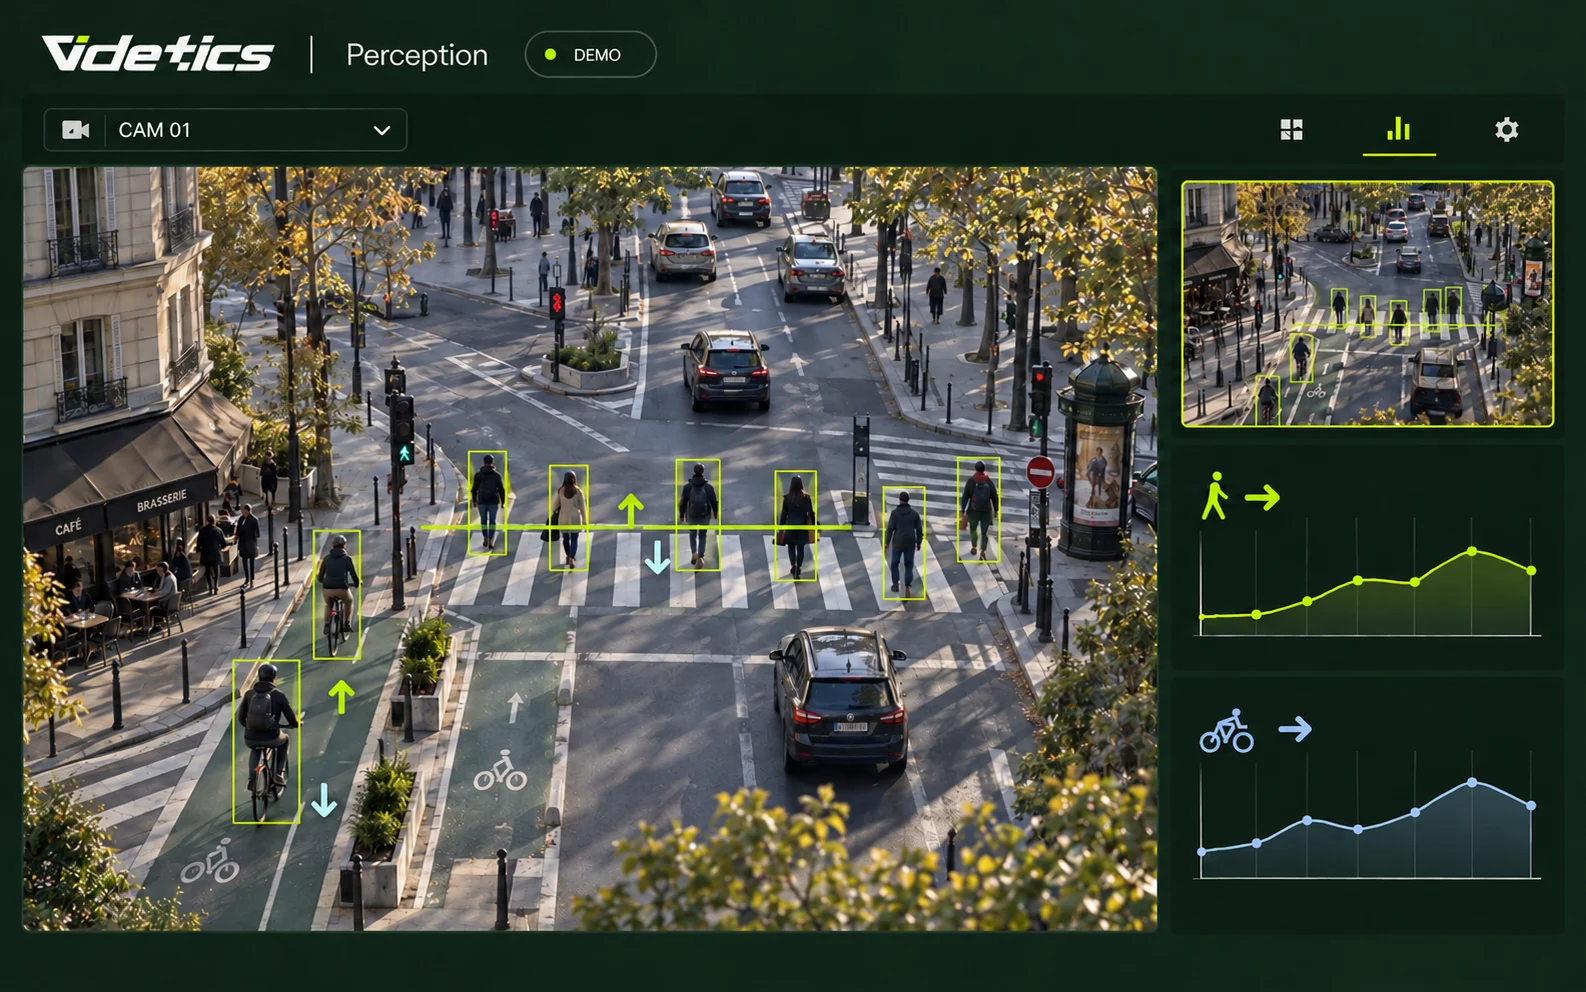
Pedestrians and cyclists at junctions
The challenge. Walking and cycling are rarely counted, so they are rarely taken into account.
What Perception does. It counts pedestrians and bicycles using the same lines as vehicles, and measures their crossing time.
What you receive. Figures by travel mode for a junction or a 30 km/h zone, ready to support a planning proposal.
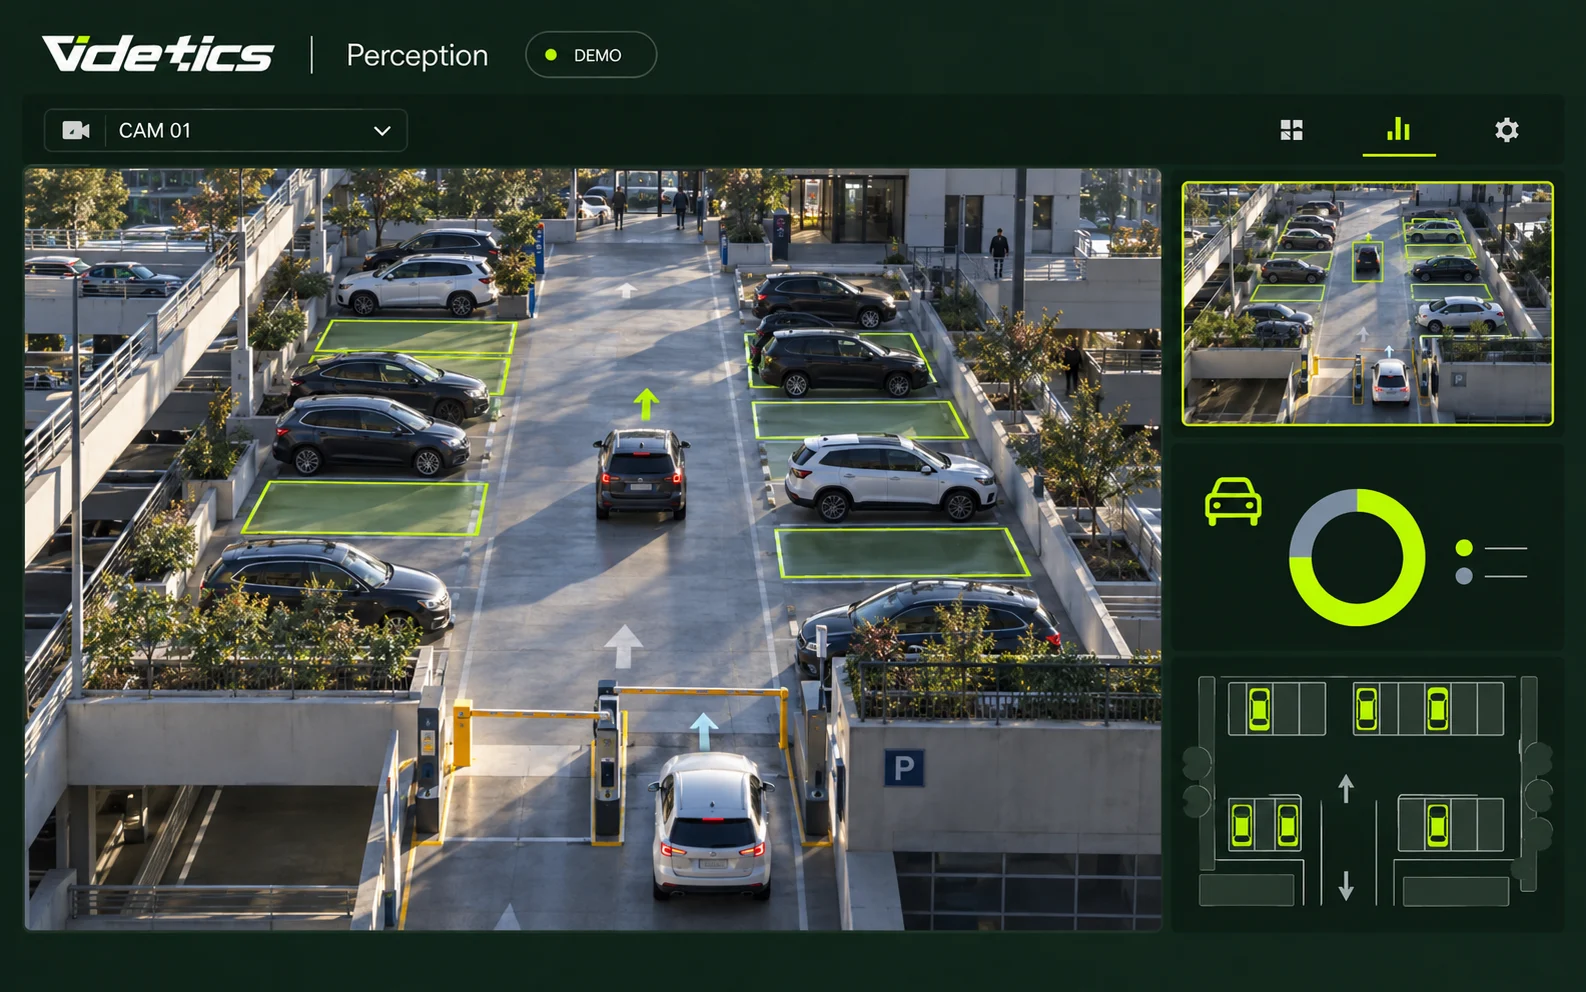
Car park and access-road occupancy
The challenge. Is a car park full, and for how long? Is a logistics access road congested at peak time?
What Perception does. It counts entries and exits, or vehicles present within a zone.
What you receive. Live occupancy and historical data, to guide users or plan delivery slots.
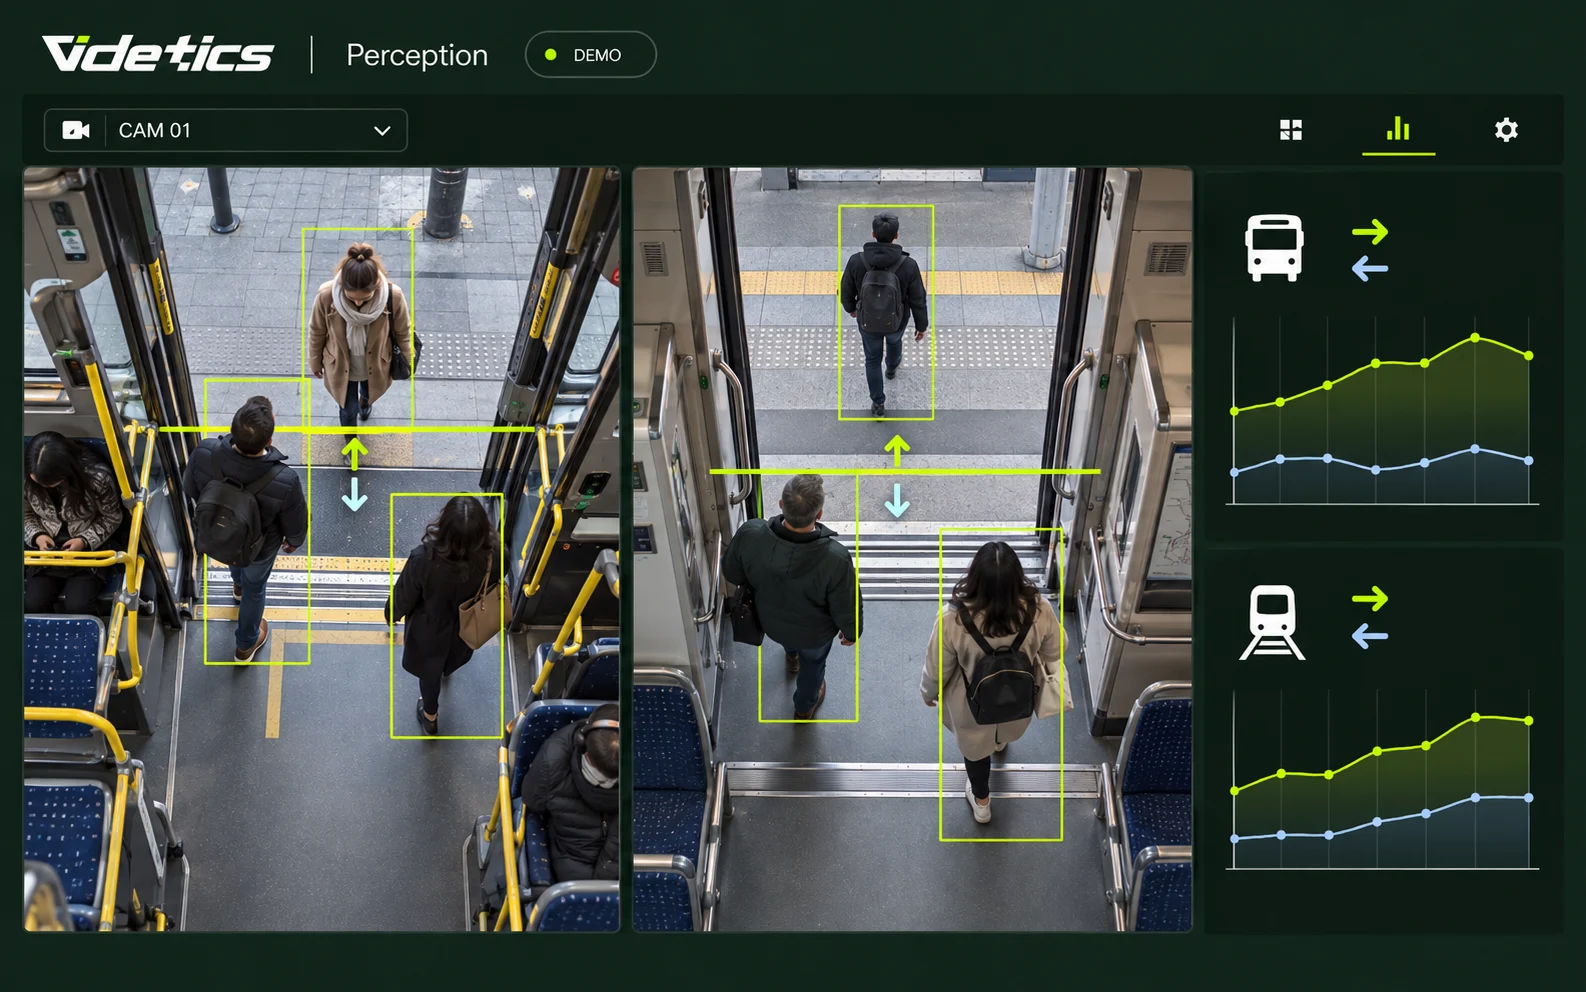
Passenger counting on buses and trains
The challenge. Which services carry the most passengers? Where do people board and alight?
What Perception does. Cameras covering the doors count boardings and alightings separately. The configuration is validated with you, taking camera angles, occlusions and operating conditions into account.
What you receive. Counts by door and time period. When combined with stop and trip data from your operational system, they support service-level ridership analysis and estimates of onboard occupancy when all doors are covered.
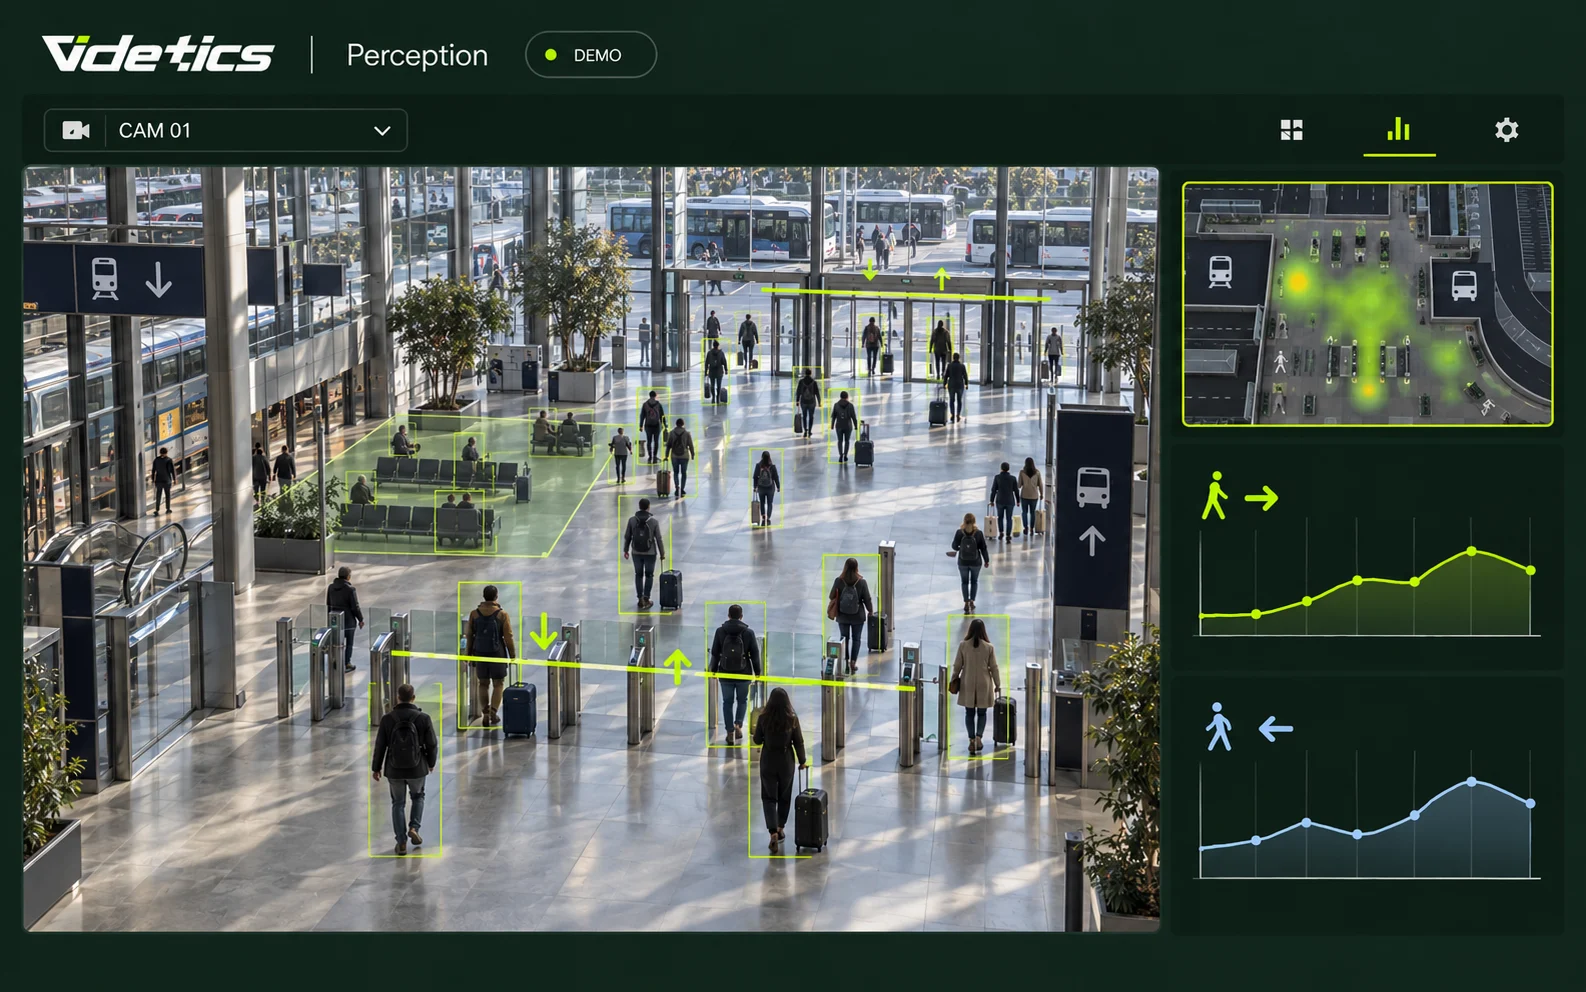
Passenger flows at stations and transport interchanges
The challenge. Which entrances handle the most passengers? When are concourses, platforms and waiting areas busiest?
What Perception does. Define counting lines at entrances and zones within the camera’s field of view. Perception measures directional flows and zone occupancy without identifying travellers.
What you receive. Footfall trends by entrance and time period, plus occupancy indicators to help plan staffing, signage and passenger flows between transport modes.
Camera or sensor: what really changes
| Loops and tubes | Temporary counter | Existing camera with Perception | |
|---|---|---|---|
| Installation | Roadworks | Installation and removal | None; software only |
| Duration | Permanent but fixed | One to two weeks | Permanent |
| What is measured | Passages, sometimes broad vehicle classes | Passages and speed | Passages, detailed classification, estimated speed, direction, pedestrians and bicycles |
| Coverage | One lane per loop | One point | Several lanes and an entire junction per camera |
| Limitation | Cost and roadworks | Temporary measurement | Depends on what the camera can see (angle, lighting and weather); thermal imaging extends night-time coverage |
Where your data goes
The Perception dashboard: traffic by lane and category, speeds, before-and-after comparisons, and CSV exports for your transport consultants.
Automated reports: weekly or monthly, by email.
Explore the Technis offering: Technis vehicle counting.
Your tools: an API connects to your GIS or mobility monitoring platform.
Passenger transport: combine counts with stop, trip and route data from your operational system to analyse ridership across the network. The scope of this integration is agreed with your teams.
How it works in practice
Connect your cameras. A Videtics server on your premises or in a European private cloud reads your road, car park and quay camera streams through your VMS or directly via ONVIF or RTSP. Up to 300 streams per server.
Lanes and zones. Draw a line for each lane, set the direction and define occupancy zones.
Calibration. For speed estimates, we set a reference distance on the image with you, then validate the counts over a real operating day.
Go live. A pilot site can cover an entire junction with a single well-positioned camera.
Who it is for
Cities and local authorities
Traffic plans, 30 km/h zones, pedestrianisation and cycle lanes: measure before, during and after, using your control room's cameras.
Roads and motorways
Traffic by lane, the share of heavy goods vehicles, wrong-way traffic on slip roads and speeds on sensitive sections.
Ports and maritime
Boat and lorry movements on quays, access-road occupancy and restricted areas.
Car parks, logistics and property
Live occupancy, delivery slots and entry flows for a site or building.
Transport operators, stations and interchanges
Buses, trains, railway stations and bus stations: measure boardings and alightings, entrance footfall and space occupancy to adapt services and improve the passenger experience.
What changes
Replace occasional counts with continuous measurement, in the same place and using the same method.
Demonstrate the impact of a layout change with before-and-after figures for each category.
Finally count bicycles and pedestrians, not just cars.
Respond in real time to wrong-way traffic or a blocked lane.
Everything is included in the Mobility package; wrong-way alerts are part of the Safety package.View packages
Vehicles counted, not identified
Perception counts and classifies; it does not read number plates by default or identify anyone. Traffic data consists of numbers, with no images retained. Faces and number plates can be blurred at source if your cameras are also used for security. We provide the documentation your data protection officer needs.
Frequently asked questions
Do I need dedicated traffic cameras?
No. A security camera with a view of the road is enough, provided its angle allows the lanes to be distinguished. We check each viewpoint with you; in some cases, a simple adjustment of the camera's orientation greatly improves counting.
How accurate are the counts and speed estimates?
Counts are validated with you over a real operating day before going live. Speed is estimated from the image and calibrated using a reference distance: suitable for planning decisions, but not certified for enforcement.
What about night, rain and fog?
Perception is trained on night-time and rainy scenes and works as long as the camera can distinguish vehicles, as it can on a lit road. In complete darkness or thick fog, a thermal camera maintains counting.
Do you read number plates?
Not by default: counting, classification and speed estimation do not need number plates. Number plate recognition may only be considered in countries and contexts where it is permitted.
Can this replace a one-off traffic study?
Yes, and it is often more useful: instead of one week's measurements every three years, you get a continuous dataset, comparable month to month and exportable in the format your transport consultants need.
Explore the solutions and the product
Your next traffic study is already on camera.
Show us a junction and the camera covering it: we will demonstrate the first counts using your footage.